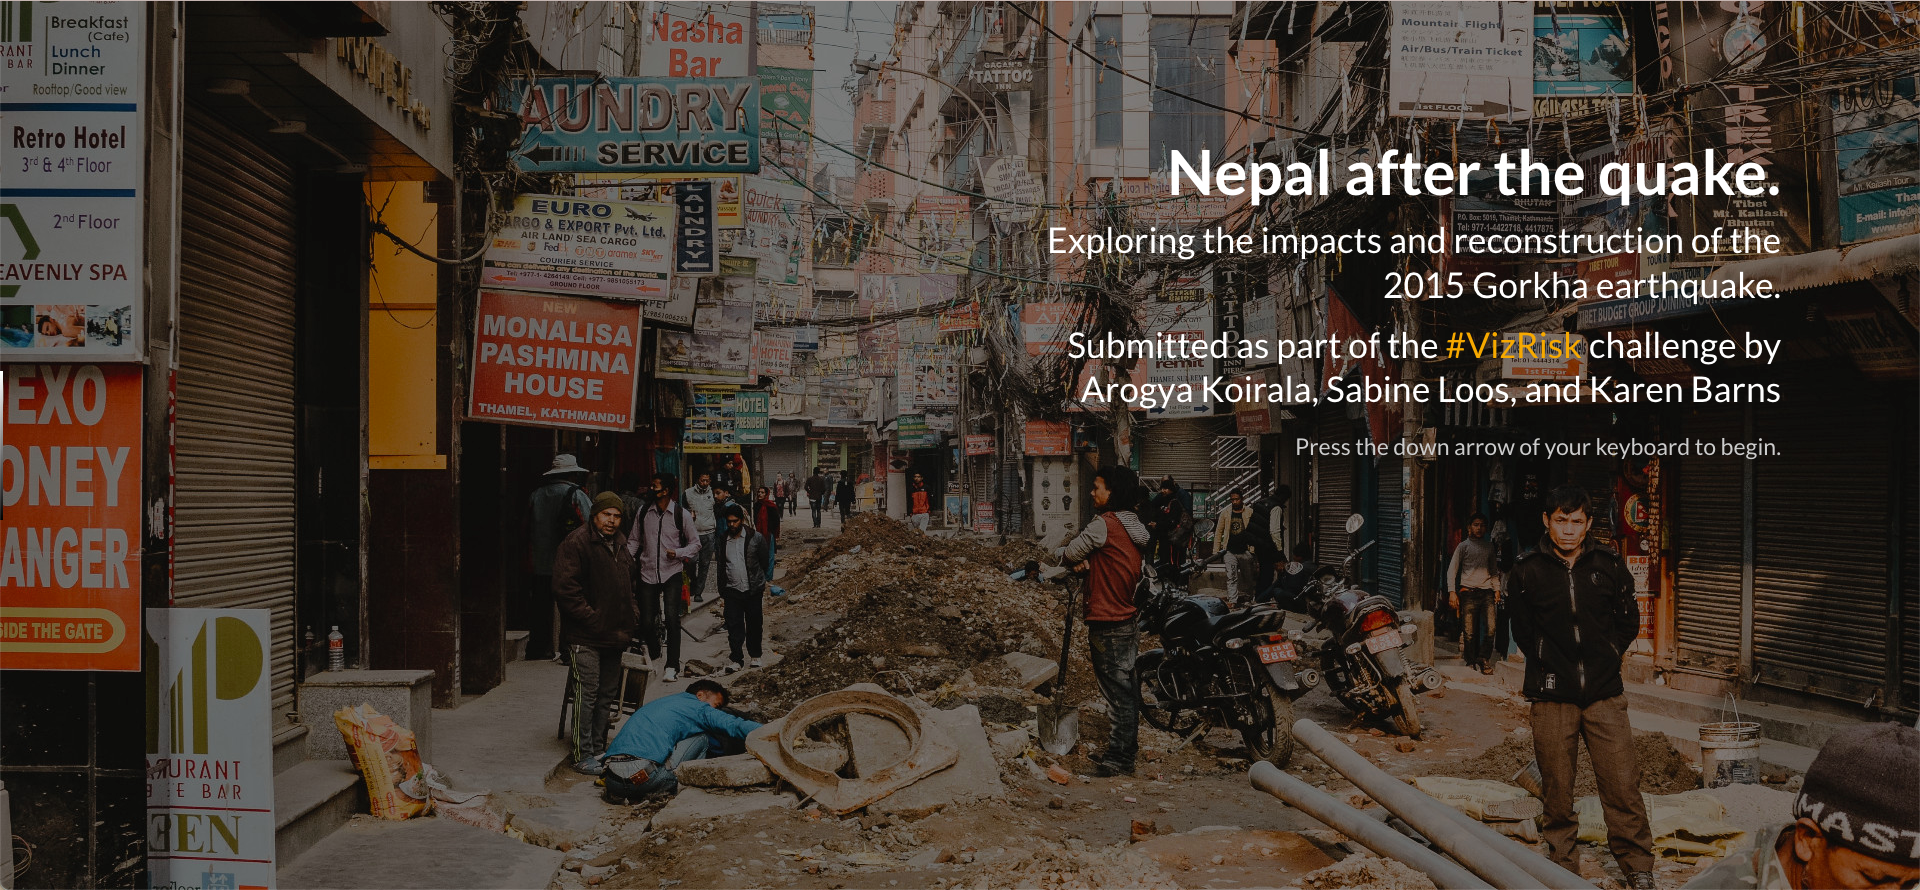
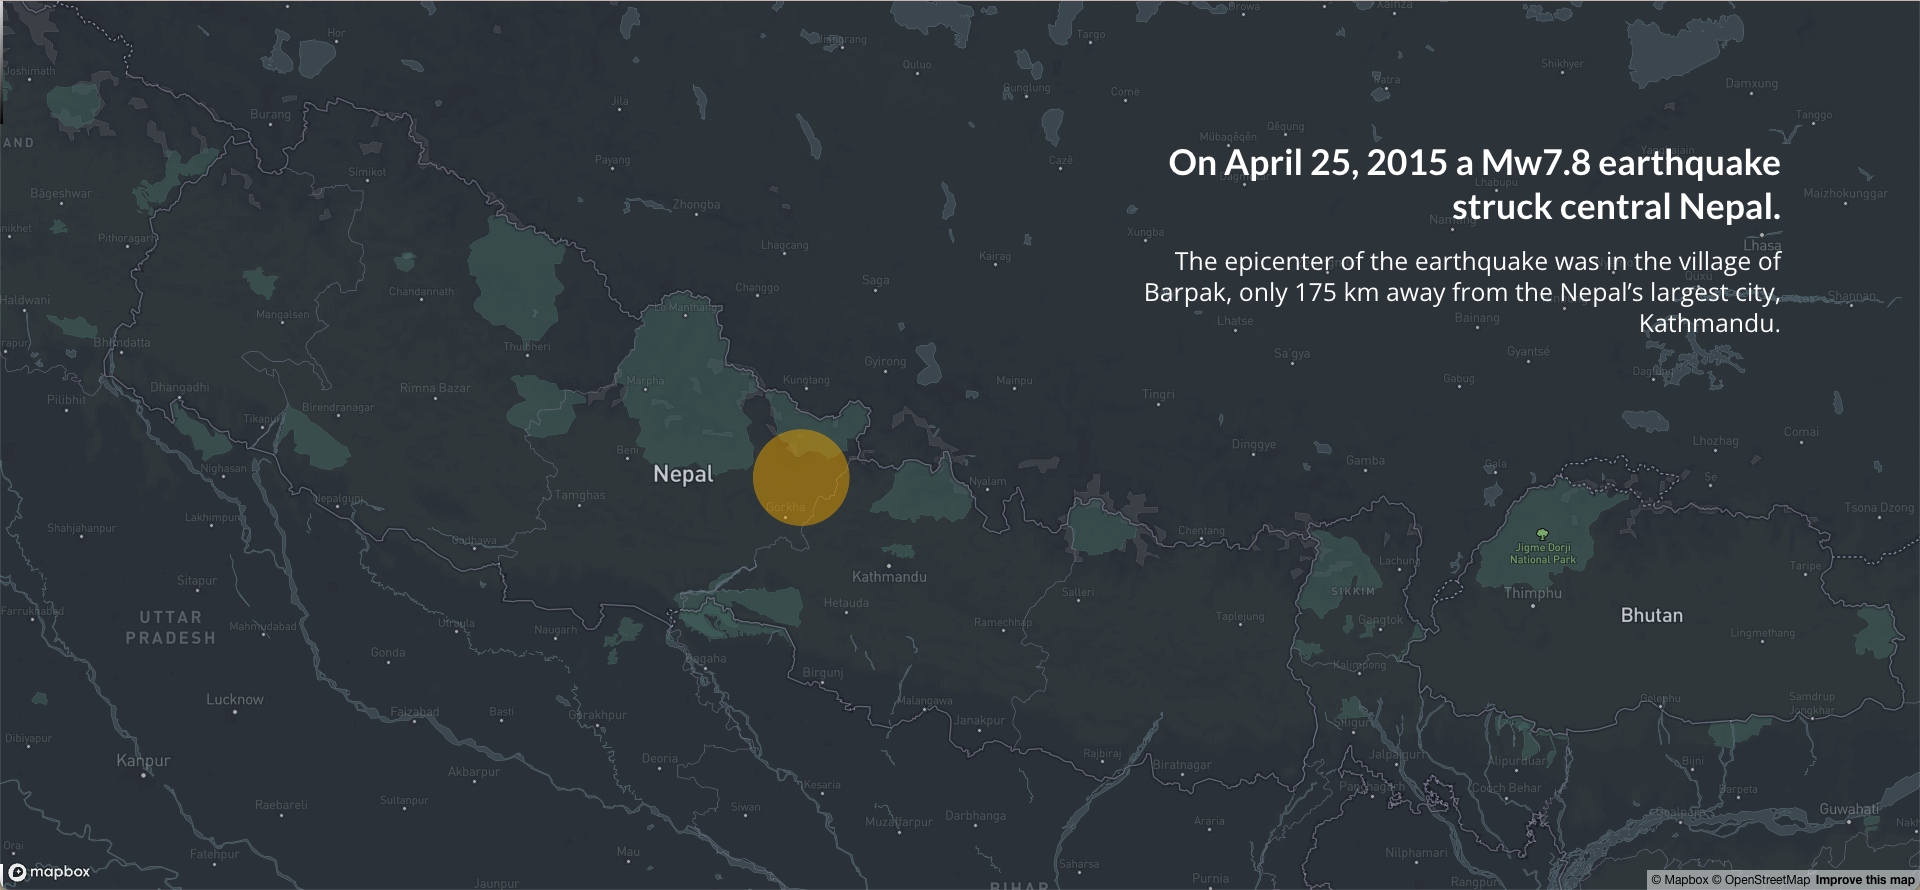
This visualization put together by Arogya Koirala, Sabine Loos, and Karen Barns looks at the impacts and recovery from the 2015 Nepal earthquake. It won Best Visual Design for the World Bank’s and Mapbox’s VizRisk Challenge.
You can read more about how this visualization was made in this blog post.


